Utilização do QGIS na Equipa de Gráficos do Financial Times
Entrevista com Steven Bernard (Editor de Desenho Interativo)
Steven é Editor Interativo de Desenho do Financial Times. Pode encontrá-lo no Twitter. Ele também publica vídeos úteis de “Como Fazer” no Youtube <https://t.co/6aTE6G8h0T>`_ para determinadas tarefas cartográficas no QGIS.
QGIS: Steven, qual é o nome da equipa em que trabalha no FT? Pode fornecer-nos um pouco de conhecimento sobre o que a sua equipa faz no FT?
Steve: de momento, a nossa equipa está num período de transição, nós temos um novo editor de visualização de dados, Alan Smith OBE (ex-ONS), que está a agitar as coisas e a criar uma única equipa gráfica. Tradicionalmente, nós tínhamos uma equipa de gráficos da Web e uma equipa de gráficos de impressão. A equipa de impressão seria responsável por todos os gráficos dos jornais, além de criar versões amigáveis para a Web. A minha equipa foi responsável por todo o conteúdo exclusivo da Web, além de trabalhar em estreita colaboração com os produtores/programadores interativos na criação de gráficos interativos.
A equipa recém-formada permitirá muito mais habilidades transversais entre diferente média.
Alan introduziu um único ritmo de trabalho digital para a nossa equipa, incluindo a utilização de d3 para ajudar a criar um vocabulário gráfico maior e a reduzir o tempo necessário para criar os visuais.
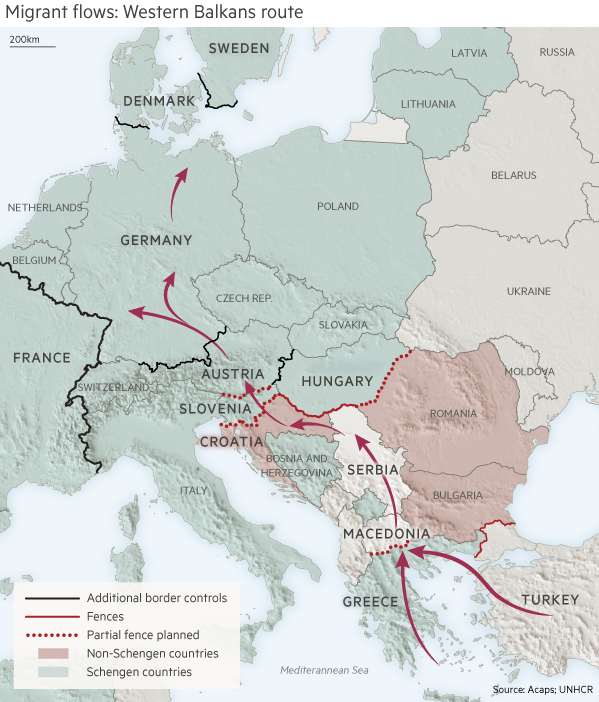
Exemplo: fluxos de migrantes. Rota dos Balcãs Ocidentais.
QGIS: quantos colegas de trabalho existem na sua equipa?
Steven: incluindo todos os desenhadores, programadores, produtores e estatísticos, nós temos uma equipa de 24
QGIS: qual é o seu papel específico dentro da equipa?
Steven: We are a multi-disciplinary department so I don’t have a specific role as such. My role includes producing responsive designs for interactive graphics as well as doing the front-end development on the less complicated interactives (e.g. Inside Isis Inc: The journey of a barrel of oil). I also produce the standard news related charts and maps on a daily basis. Over the past two years I have been concentrating on developing our cartographic offerings at the FT. QGIS has been instrumental in changing how we produce maps, and in conjunction with other tools such Blender have helped me to be more creative with how we approach maps.
*Exemplo: Animação da Jornada de Dora da Nigéria para a Sicília - uma dos milhares de mulheres traficadas a cada ano. *
QGIS: pode contar-nos um pouco sobre si? Qual é a sua formação educacional? O que fez antes de ingressar na equipa de visualização de dados do FT?
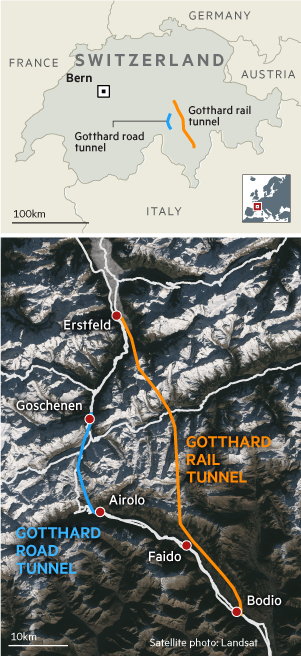
Exemplo: Túnel ferroviário e rodoviário de Gothard nos Alpes suíços.
Steven: I am traditionally trained as scientific illustrator. What’s that I hear you ask? It involves producing illustrations for medical journals, natural history publications anything where you are trying to convey information visually where a photograph can’t. Think of diagrams showing the human circulatory system, or showing a procedure to fix a broken bone. Sadly there wasn’t much call for that kind of work when I left university and I basically fell into the job at the FT. I have always been good at maths, which I think is important when working with data visualisations, it has certainly helped me with my coding as well.
QGIS: como é que descobriu o QGIS?
Steven: eu deparei-me com o QGIS em 2013, quando nós estávamos a trabalhar num projeto de mapeamento de etnia do Médio Oriente
We used it to georeference maps that were created by a professor at Columbia University. At first I found it really tricky using the add feature drawing tool, probably because it was unlike anything I’d used in Adobe Illustrator for 17 years prior! I also found it frustrating that you had to save things twice, once when done editing the shapefile, then again to save the project. However, this was just down to inexperience with the program and in the end it did exactly what we needed, which was to produce shapefiles that we could add to a Mapbox base map.
QGIS: qual é o papel do QGIS dentro dos seus fluxos de trabalho habituais?
Steven: QGIS is now an integral part of our mapping workflow. I don’t use any other GIS tool to create our maps. Although a few members of our team also use Map Publisher as they feel more comfortable staying within Adobe Illustrator. I would say 80% of our maps are now produced in QGIS.
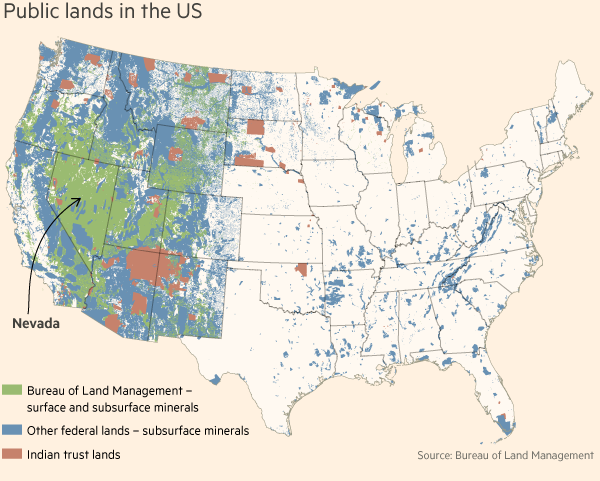
Exemplo: Terras Públicas nos EUA.
QGIS: Que outras ferramentas utiliza além do QGIS e como as combina?
Steven: se for apenas um mapa localizador simples, 95% do trabalho é efetuado no QGIS, com o polimento final efetuado no Adobe Illustrator.
If I am doing a relief map, then the process is a lot more complex. I will retrieve DEM files from Nasa Earth Explorer, and bring them into QGIS to crop to size. I will then take the cropped DEM into Blender to create a 3D render. If I am using a satellite overlay on the hillshading then I will download a BlueMarble image from Nasa and take this into Blender as well. The exported render from Blender is then brought back into QGIS to use as a background layer. I may tweak it in Photoshop beforehand if necessary.
For responsive maps like those in the Isis oil story, I used all of the above tools but the final step is to use an open source Adobe Illustrator script developed by the New York Times’ Archie Tse. This allows me to create responsive versions of my maps that work on all devices.
Another tool that is useful is Google My Maps which allows reporters around the world to mark locations on a map and then we can download them as a kmz file and import them straight into QGIS.
A ferramenta final que eu utilizo é o Adobe After Effects, pois recentemente, eu comecei a animar os meus mapas para levar o utilizador numa jornada. Como utilizado recentemente na série Land Rush:
QGIS: Utiliza outras ferramentas espaciais ou GIS além do QGIS e, se sim, quais?
Steven: QGIS é tudo para mim, mas como mencionado acima, alguns dos meus colegas também utilizam o Map Publisher.
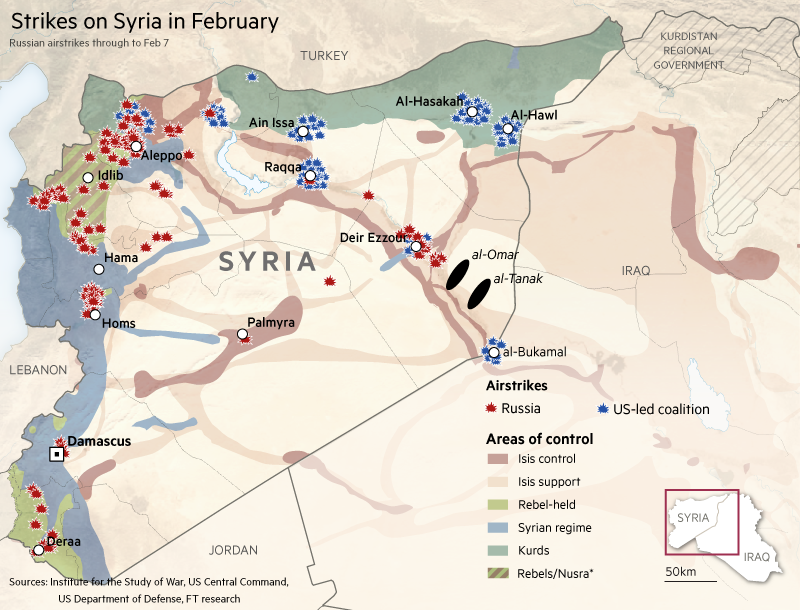
Exemplo: Greves na Síria em fevereiro de 2016.
QGIS: Pode descrever os pontos fortes e fracos do QGIS em relação às tarefas que tem de executar?
Steven: When I first used QGIS I saw it as a specialist tool, fit for only dealing with specific tasks. I really didn’t see it a production tool. In late 2014 two of my colleagues went on a QGIS course held by Alasdair Rae at Sheffield University. They both enthused about how good QGIS was, so I took it upon myself to evaluate it as a tool that could be used to produce all our maps.
Within about two weeks I was convinced that it would be viable. The main selling point was the ability to set up style guides for everything including zoom level styling for street-level maps.
I have a system set up where we have sets of Google sheets with columns for name, lat, long, marker-icon, fontweight, fontsize and whether you want the marker visible or not.
The marker icon is a dropdown connected to a vLookUp table which fills in all the details for that marker.
So all I have to do is download the csv, import it into QGIS, apply a style and I have a map that is 95% ready to go.
To be perfectly honest I can’t think of any weaknesses, there are a couple of things that I would like to see or be able to do but, I don’t see that as a weakness, just a missing feature.
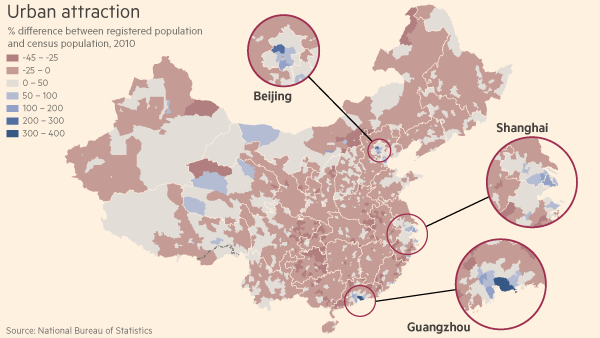
Exemplo: Atração Urbana e Migração na China.
QGIS: Quais são os conceitos ou funcionalidades que mais gosta no QGIS?
Steven: There are numerous features that I would class as life savers! But primarily Quick OSM and Georeferencer have saved me so much time, this is absolutely essential when deadlines are tight. Which, when working for a news organisation, is usually 90% of the time.
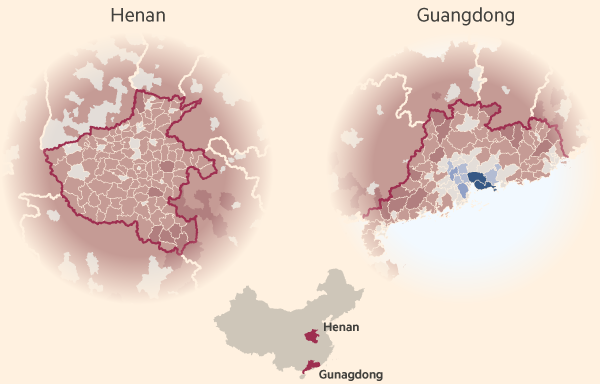
*Exemplo Atração Urbana e Migração na China. Visualizações de detalhes. *
QGIS: Quais as caraterísticas ou funcionalidades do QGIS que mais sente a falta? Tem uma lista de funcionalidades em falta que o ajudariam muito, se implementadas?
Steven: algumas coisas que eu gostaria de ver em versões futuras são…
Bezier curve support, this would be particularly useful in conjunction with Georeferencer. I know there is a spline plugin but it doesn’t give you the full control a bezier curve would.
Being able to save as image at larger file sizes. Currently this is the only way I can create a georeferenced crop of a DEM file to take into Blender. But it is limited to the size of your screen. If I had an 8,000 pixel DEM file loaded into QGIS I would like to be able to export the crop at a larger size than my screen for use in HD video for example.
QGIS: If you miss certain features in QGIS that would help you - would you consider improving QGIS yourself (with coding in QGIS core or Python plugins), or would you consider to hire a QGIS developer to implement the missing feature for you? Or would you instead look for other tools to fill in that gap?
Steven: I certainly don’t have the necessary skills to do the coding myself, I’m fairly proficient in Javascript but would struggle with Python. I would love to hire a developer to get features implemented but unfortunately I’m not in control of any budgets, so I use other tools to get around this.
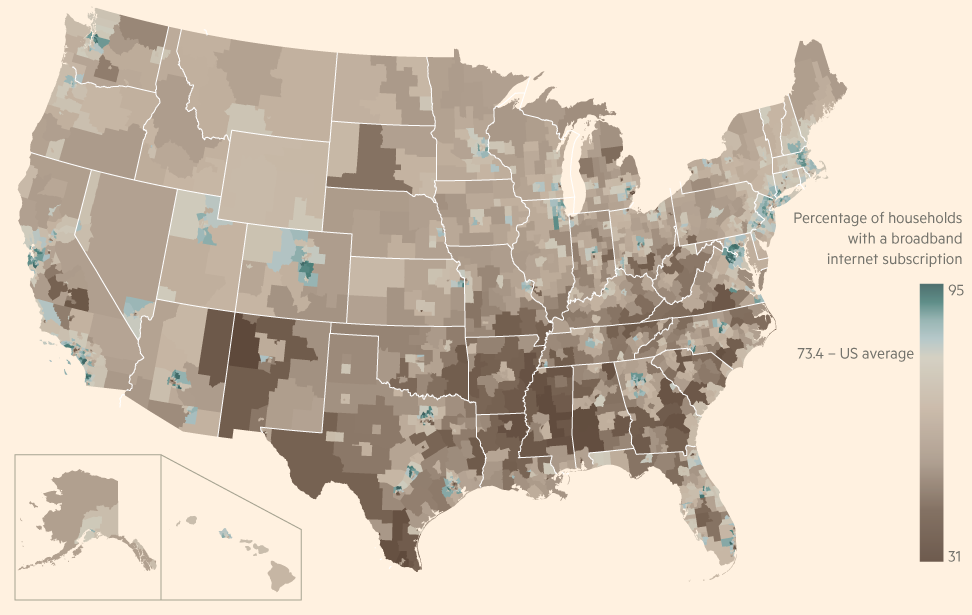
Exemplo: Percentagem de famílias com assinatura de Internet de banda larga nos EUA.
QGIS: Let’s talk about user experience - the QGIS team is aware that there are various places in the UI (dialogs, panels, etc) that could be improved a lot. Can you tell us a little bit where in the UI you see the biggest potential for a UI overhaul?
Steven: I think the main tools are fine as they are, once you are familiar with them they’re pretty obvious. However, one thing I do find a little frustrating is trying to hunt down a plugin once it’s been installed. They either create their own menu (MMQGIS), live under one of the menus (Georeferencer) or create their own icon (threejs). It would be handy to have a plugin window that has all installed plugins in it. Again this isn’t a deal breaker but would make it easier than hunting in several different locations.
QGIS: Obrigado pelo seu tempo e pelo trabalho que faz para promover e documentar os ritmos de trabalho no QGIS!
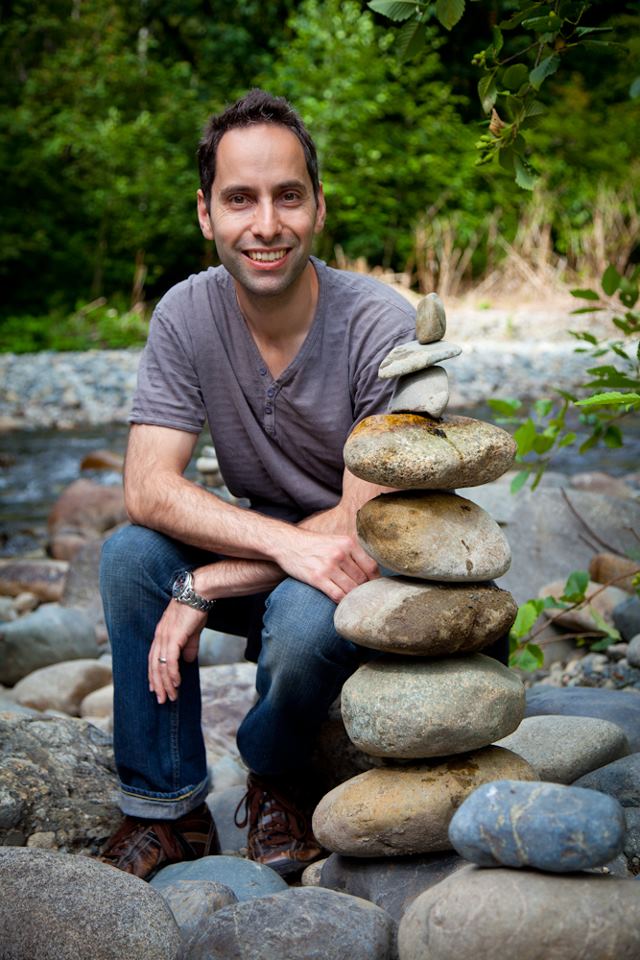
Retrato de Steve Bernard. Editor de Desenho Interativo no Financial Times.
Steven: Um prazer, eu estou quase evangélico sobre o QGIS! Daí os 31 tutoriais em vídeo <https://t.co/6aTE6G8h0T>`_ e sempre feliz em espalhar a palavra.
Perguntas da entrevista de A. Neumann e T. Sutton. Abril de 2016.